Understanding the Double Top Chart Pattern: A Complete Guide
The Double Top chart pattern is one of the most reliable reversal patterns in technical analysis. Often found after an extended uptrend, it signals that buying pressure is fading and a potential trend reversal to the downside may occur. If you want to master how to trade double top chart pattern, understanding its structure and entry rules is essential.
What is a Double Top Chart Pattern?
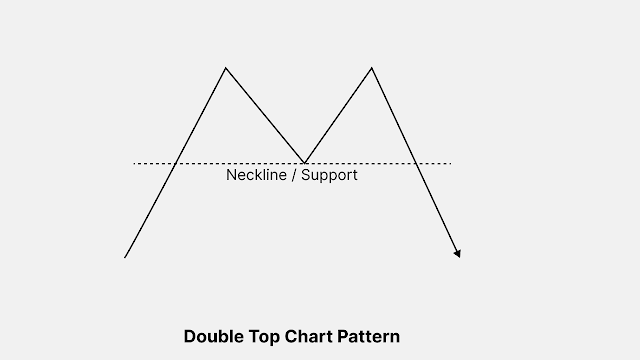
The Double Top chart pattern resembles the shape of the letter “M.” It forms when the price reaches a high, pulls back, and then retests that high again — but fails to break above it. The failure to break higher confirms that buyers are losing strength.
Key Components:
-
Two Swing Highs: Roughly at the same level, showing resistance.
-
Neckline (Support Level): Drawn at the low between the tops.
-
Breakout Confirmation: Price closing below the neckline.
How to Trade Double Top Chart Pattern Effectively
Learning how to trade double top chart pattern involves more than spotting the "M" shape. It requires understanding confirmation signals, entry points, and risk management.
Step-by-Step Trading Strategy:
-
Identify the Pattern: Wait for two peaks to form at nearly equal highs.
-
Wait for the Neckline Break: Don’t enter prematurely. Confirm the breakdown of the neckline with volume.
-
Entry Point: The ideal double top chart pattern entry is just below the neckline after a valid breakout.
-
Set Stop-Loss: Place a stop above the second top to limit losses.
-
Profit Target: Measure the distance from the top to the neckline and project it downward.
Common Mistakes to Avoid
-
Entering Before Confirmation: Jumping in too early often leads to losses.
-
Ignoring Volume: A breakout without increased volume can be a false signal.
-
Forgetting Risk Management: Always use stop-loss and position sizing.
Best Indicators to Combine with Double Top Pattern
To improve accuracy when trading this pattern, you can pair it with:
-
RSI: Look for bearish divergence at the second top.
-
MACD: A bearish crossover can support the reversal signal.
-
Volume Analysis: Falling volume on the second top increases pattern reliability.
Final Thoughts
The Double Top chart pattern is a powerful tool in a trader’s arsenal. With the right approach, it can offer high-probability setups. Remember, mastering how to trade double top chart pattern involves patience, discipline, and confirmation-based entries. Always wait for a valid double top chart pattern entry to improve success and reduce false signals.


Post a Comment